
Run history shows what happened to a profile after a manual start, a cron start, or a start triggered by another event. It is a diagnostic log: it shows when the profile started, how it was started, how it finished, and which message the service returned.
History does not change profile settings and does not rerun processing. Use it to check whether automation actually ran, why a run was skipped, and where to look for the problem.
How to open history
- Open Interpreter and find the profile.

- Click the history icon in the profile card.
- In the history window, check the date, run type, status, and comment.
Saved result versions
The latest result and saved versions are also shown in profile settings, in General settings. The block shows result files, creation date, size, run ID, and the actions Download and Open run.
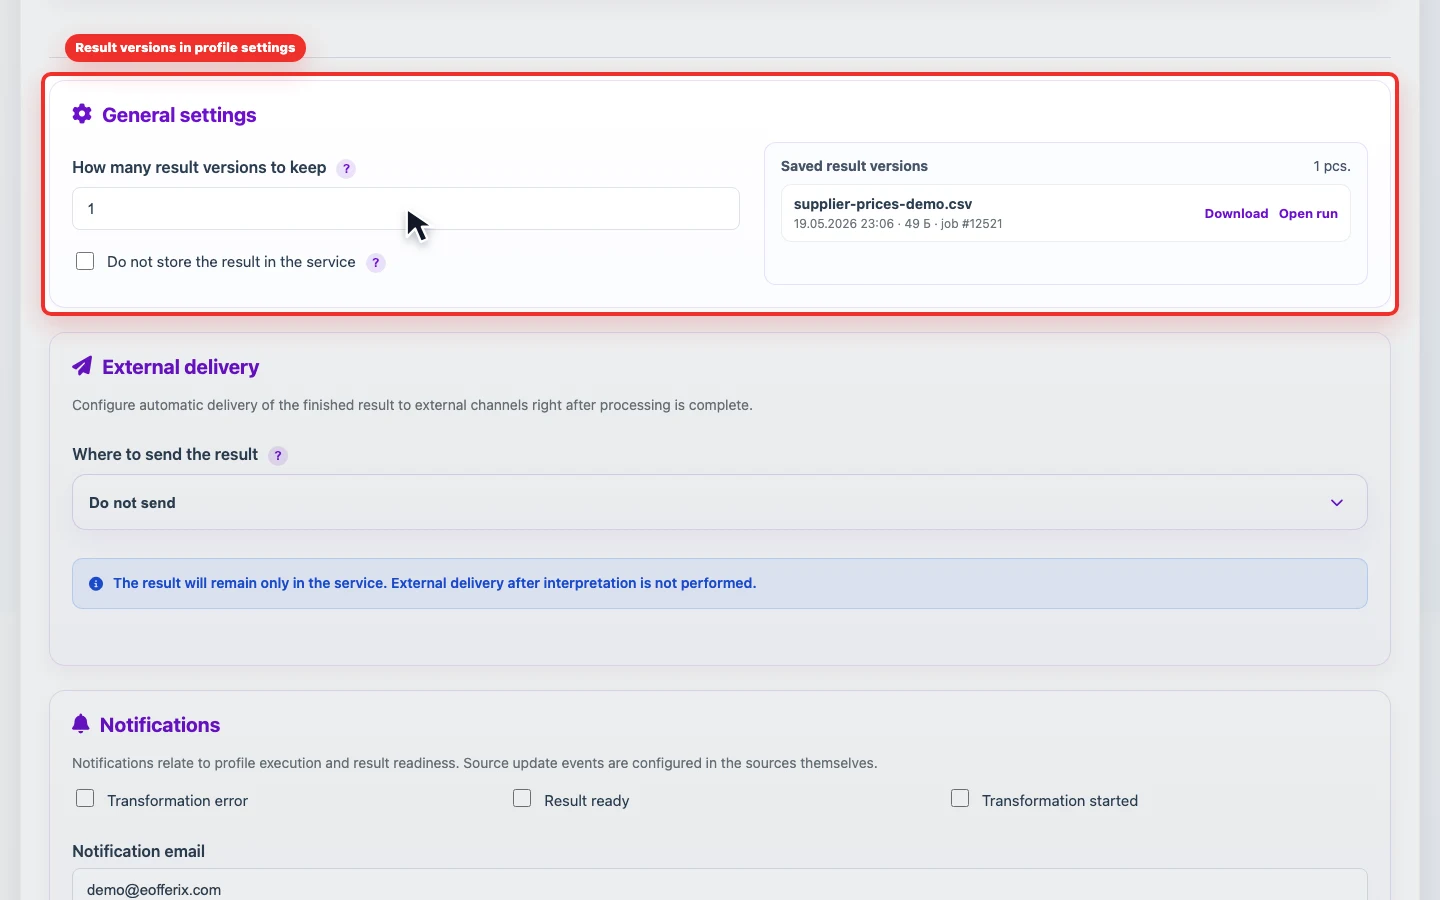
How many result versions to keep defines how many latest result files remain in the service. The default is 1 version, and the maximum is 30. When a new result appears, older versions above the limit are deleted automatically.
Do not store the result in the service is useful for one-time or sensitive exports. When enabled, the result is deleted automatically at the next 00:00 UTC. Run history remains, but the old file cannot be downloaded after deletion.
What to check
| Column | How to read it |
|---|---|
| When | Date and time of the attempt. If there are many runs, compare the time with the profile schedule or the task in the global scheduler. |
| Run | Shows how the run was started: manually, by schedule, or after an event. |
| Status | Completed means the run finished successfully. Skipped means the service did not run the profile, for example because the source did not change. An error points to a failure that should be checked through the message. |
| Action | Briefly describes the operation: profile autorun, manual interpretation, export, or event-based start. |
| Comment | The main diagnostic field. It explains whether the profile completed, whether the source changed, why the run stopped, or what needs fixing. |
When history helps most
- after setting a schedule: check that the profile actually starts at the expected time;
- after enabling event-based execution: make sure the dependent profile starts after the selected source or profile;
- when a file did not update: compare the last successful run, skipped attempts, and error text;
- before changing rules: record the last working state so you can compare the result after editing.